Leonardo Cataldi's blog for Statistics' homeworks
Blog for Statistics' homework
Research 1 - What is Statistics?
The word “Statistics” comes from german “statistik”, meaning “description of a state”. In fact, Statistics can be defined as the science of collecting, analizing, and interpreting data in order to obtain knowledge about a certain topic and take decisions based on that knowledge: since the origin of the term, related to the decisions taken to wisely regulate a nation. Statistics is mainly related to data: as a science, it provides those instruments that are necessary to summarize a large amount of unorganized information and extract from them that knowledge necessary to achieve the most various purposes. Statistics is also used by the major part of oter sciences, since it is an instrument of the scientific method: Statistics is used to prove theories true or false, as for validating the effectiveness of a medicine, ecc…
Statistics can be divided in 2 major branches:
-
Descriptve statistics
-
Inferential Statistics
The first branch is related to collecting data and showing them in a way that makes them understandable from the general public. In order to achieve that purpose, descriptive Statistics summarizes observation in either a descriptive or a visual way. A simple example of that is the visual representation of data in a graph.
The second branch is, instead, used to infer the properties of a population testing hypotesis on a random sample of that population. This particular branch of Statistics is very important for all the other sciences, because allows, with a predictable possible error, to validate theories regarding a specific set testing them only on a sample of that set. An immediate example of that are the medical trials used to certificate the safety and the effectiveness of a medicine.
Although we earlier defined it as a science, Statistics, like Mathematics, does not use the scientific method: it is instead, as mentioned, an instrument of the scientific method. We can still, though, consider Statistics as a science with the meaning of an organized and sistematic set of knowledges and formal instruments.
References - Q1
[1] https://www.britannica.com/science/statistics
[2] https://en.wikipedia.org/wiki/Statistics
[3] https://it.wikipedia.org/wiki/Statistica
[4] https://en.wikipedia.org/wiki/Descriptive_statistics
[5] https://en.wikipedia.org/wiki/Statistical_inference
Research 2 - What is a Dataset? From statistical units to the dataset variables and observed values
A so called Statistical unit is a single member of a specific set of entities being studied. For example, a statistical unit can be a single person from the set of the people living in Rome, a single car from the set of all the vehicles registered in italy, ecc…
In order to organize and classificate some informations about the set being studied, an instrument that can be used is the Dataset, that is a collection of data regarding the mentioned set. In order to create a Dataset, first of all we have to choose which kind of informations from the source we want to summarize and represent: this means that we have to choose the attributes of the units that will be reported in the Dataset. \ In fact, every unit from a common set will have specific features in common with all the other units, for example the height for a person or the horsepower for a vehicle: those common features are the attributes of the units. The value assumed by the attrubutes can vary from unit to unit, and the set of the possible values assumed by a single attribute (the so called operational versiopn of the attribute) must be chosen at the creation of the Dataset. As an example, we have to imagine that i can report the height of a person in meters, or simply say if a person is tall, short or average height. We are hence operationalizing the attribute as a variable that can assume certain values.
Therefore, after choosing the set to observe, the attributes of the units to represent and the operational version for each attribute, to create the dataset we need to do actual measurements and observations for each unit and report the valued assumed by the attributes we chose to summarize. The structure of the obtained Dataset is described by the image below:
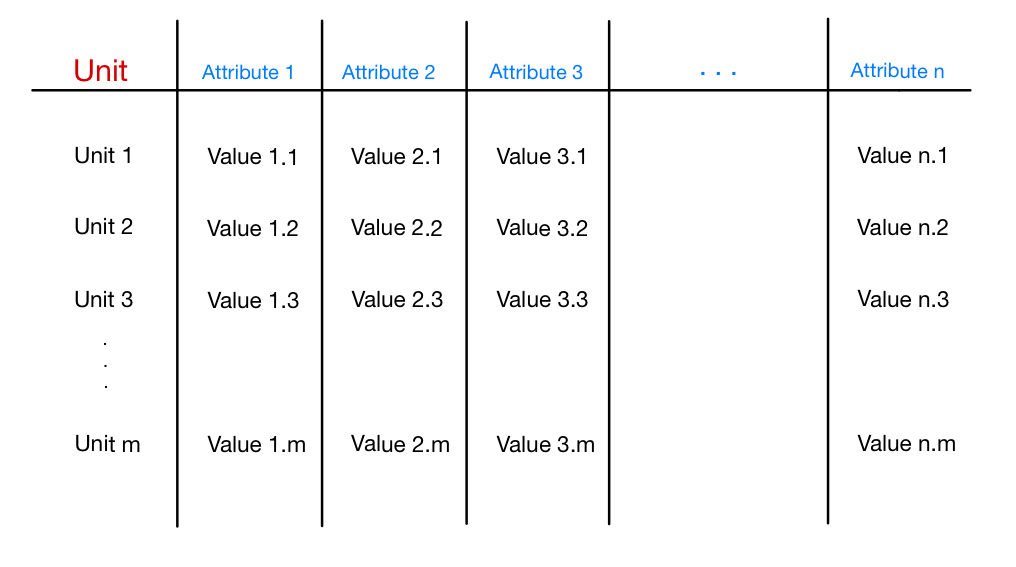
We can notice how the structure of the Dataset is divided in rows and columns. The first column regards all the statistical units of the set, while the other columns regard the attributes that we chose to represent in the Dataset. For each statistical unit, then, we have a row: for each attribute the dataset contains the valued assumed by it for that specific unit. A Dataset can then be defined as a structured set of data.
Thanks to this formal structure, there are various ways to memorize and elaborate a Dataset: a simple way to memorize a Dataset could be an Excel sheet, but there are also more complex systems, called DBMS (DataBase Management Systems), that allow to memorize Datasets, to regroup more of them in bigger Databases and to create links from one to another, and that also offer formal ways to retrieve data from them. We can also create algorithms to manipulate this structure.
To conclude, thanks to the Dataset structure we can have a first representation and summary of the relevant data regarding a certain population. Those data can now be analyzed with the tools that Statistics offers.
References - Q2
[1] https://en.wikipedia.org/wiki/Statistical_unit
[2] https://en.wikipedia.org/wiki/Variable_and_attribute_(research)
[3] https://www.intelligenzaartificialeitalia.net/post/cosa-%C3%A8-un-dataset
Research 3 - Find and list interesting applications of Statistics in Cybersecurity
In research 1, we defined Statistics as a science that formalizes tools to collect and analyze data in order to get knowledge about the most various topics. We also underlined how these tools are used widely in all other sciences and scientific fields. Also in Cybersecurity, analyzing network and other data with Statistics can provide important informations that allow us to take better decisions and design the most suitable strategies to protect a system.
First of all, thanks to Statistics we can analyze the frequency of cyber attacks, in order to understand if their frequency is increasing or decreasing. For example, cybercrime in 2020 increased by a percentage of 19% compared to 2019[1], going higher. Such a statistic points out how important is to adopt risk management techniques in order to avoid or mitigate possible damages to the attacked systems.
Another information we can draw from statistics is which are the main targets of cyber criminals, and what is their purpose. As an example, it’s documented that the 50% of the cyber attacks are directed against the SMBs (Small and Medium Businesses). Hence, it seems clear that those kind of businesses need more cyber protection, something that has a cost: in 2021, enterprises saw the annual cost of cyber security increase 22.7%[2]. In order to mitigate those costs, it may be useful to identify which are the major treaths and the weakest points, to do a mirate risk management without protecting something less important. Also this information can be drawn by statistics.
As an example, it was calculated that 85% of breaches involve human interaction and then human mistakes[3], something that is linked to the fact that since 2016 phishing substituted malaware as the fist form of attack in malicious websites[4]. An information to be understood from those data is that doing an appropriate training to employees is as important as (if not more important than) creating a secure infrastructure.
We can then get informations about the best prevention methods, with AI-driven security that has the best benefits-cost ratio[2].
To conclude, Statistics can be applied to Cybersecurity as it’s applied to any other field that needs to plan and to manage risks: to understand the behaviour of the adversary and to contrast it in the best way.
References - Q3
[1] https://www.websiterating.com/it/research/cybersecurity-statistics-facts/
[2] https://purplesec.us/resources/cyber-security-statistics/#Cybercrime
[3] https://www.shrm.org/resourcesandtools/hr-topics/technology/pages/data-breach-report-emphasizes-cybersecurity-human-element.aspx
[4] https://purplesec.us/resources/cyber-security-statistics/#SocialEngineering